|
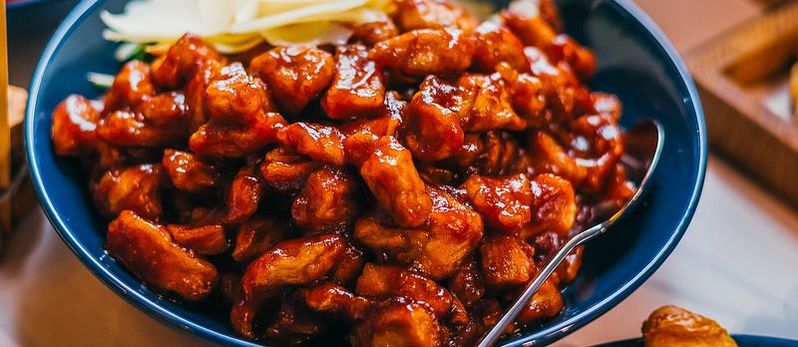
For the Chapter 1 project, my partner Cole and I conducted a survey within our stats class to determine everyone's favorite type of food. Students were given the options of American, Italian, Mexican, Chinese, and Other for their favorite types of food. After finding the results, we discussed what level of measurement our study fell under, what type of survey it was, and more.
|
|
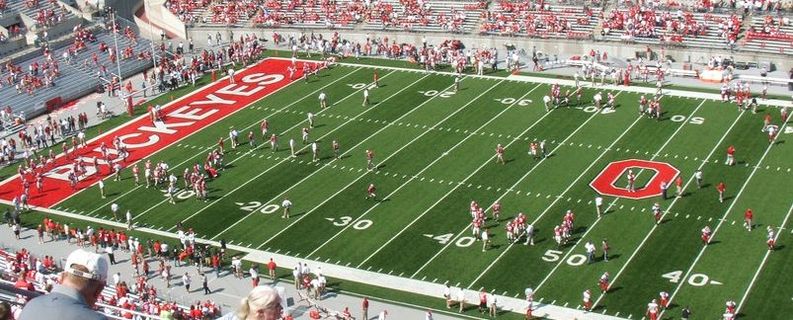
For the Chapter 2 project, my partner Olivia and I conducted a study on the top college football players based on their touchdowns as of October 5, 2017. We used different types of graphs to display our findings for that day in the season. We also found the mean, median, and mode for our data, and determined which of these would be best to represent our findings.
|
|
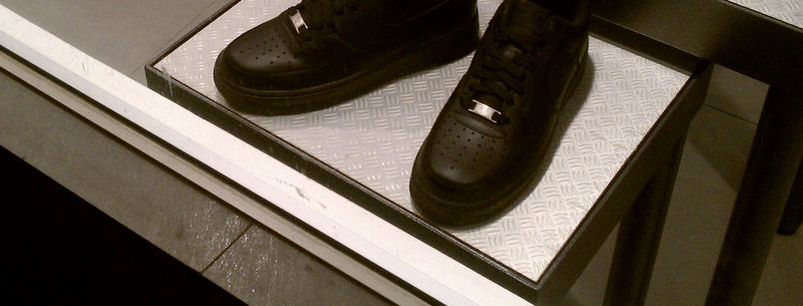
For the Chapter 3 project, my partner Elizabeth and I surveyed students in Fowler High School on their shoe size. We sent out an online survey to students at Fowler High School, and used that data to create a stem-and-leaf plot. We also found and explained the standard deviation, 5% trimmed mean, and Chebyshev intervals of our data, along with other information. We then analyzed what this meant in relation to our survey topic.
|
|
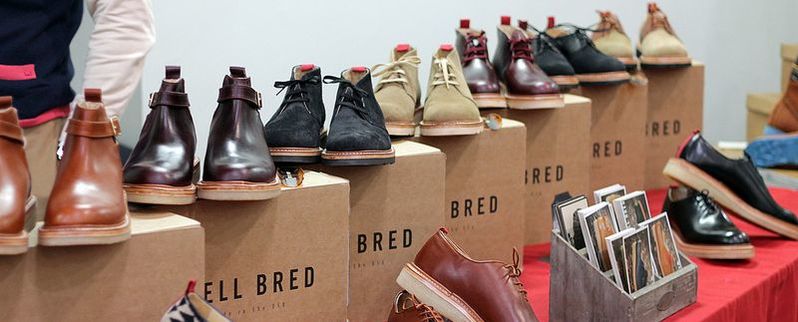
For the Chapter 4 project, my partner Brooke and I surveyed 50 students in Fowler High School on their shoe size and how many pairs of shoes they owned. We surveyed students from Fowler High School, and used our data to create a scatter plot. We then found the correlation of our data, and explained why this may be. We decided that lurking variables may have been a factor, then decided on what potential lurking variables could have been present. We then analyzed our collected data.
|
|
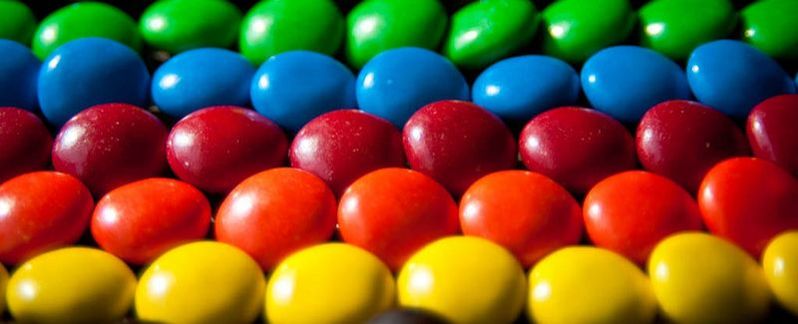
For the Chapter 5 project, my partner Dylan and I conducted a study on the probability of drawing different colored M&Ms out of a bag. We first created a visual of the sample space of our study to help predict potential outcomes. We then found the probability of certain outcomes, and determined if our event was independent or dependent, and whether or not our event was mutually exclusive among other things.
|
|
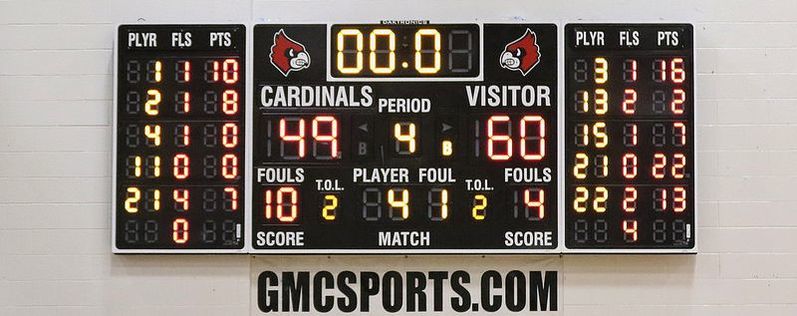
For the Chapter 6 project, my partner Viktor and I conducted a study on the binomial probabilities of making free throws. We first explained the different types of random variables and the key components of a binomial experiment. We then found the binomial probability of making 8 free throws out of an attempted 16 shots.
|
|
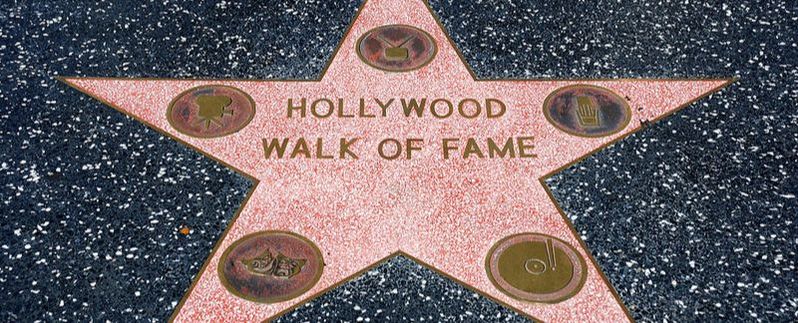
For the Chapter 7 project, my partner Mariele and I surveyed 50 people on how many movies they had watched in the the past month. We surveyed students from Fowler High School, and used our data to create a histogram. We then found the probability that others would choose our exact data point and where most of the data fell in relation to one another. We then analyzed our collected data and found the raw data value for our data set.
|
|
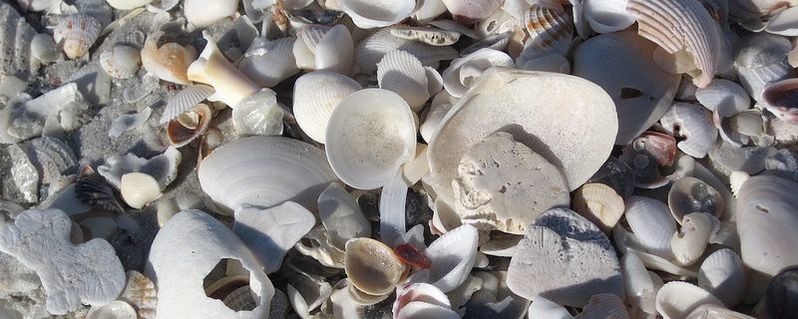
For the Chapter 8 project, my partner Victor and I studied the lengths of littleneck clams in Garrison Bay. We found the critical value for varying confidence intervals and the maximum margins of error for these varying confidence intervals. We then analyzed what we would have changed had we been given the entire population rather than a small sample of the clam population.
|

|
For the Chapter 9 project, my partner Olivia and I surveyed 30 people on how much they use Facebook per day on average. We then created a null and alternate hypothesis in regards to our data set. We then calculated to see if our alternate hypothesis was possible using a 5% level of significance. We then analyzed our collected data and explained what the results meant in relation to our alternate hypothesis.
|
